Renting in England
Renting in Babergh
The average private rent in Babergh is £970 a month (Office for National Statistics, September 2026), +3.3% on a year earlier, and £496 less than the England average of £1,466. Below: rents by bedrooms, what you need to earn and have saved to move in, and the local rules worth knowing before you sign.
England · Figures for September 2026, published 21 October 2026
- Average rent
- £970 a month
- ONS, September 2026
- In the last year
- +3.3%
- England +4.0%
- Against England
- £496 less
- England average £1,466
- Most expensive councils
- 180th of 294
- by average rent
What stands out in Babergh
- Rents in Babergh are rising more slowly than a year ago: 3.3% in the latest year, against 4.9% the year before.
- Since September 2021 the average rent here has gone from £733 to £970, a rise of 32.3%: less than the 34.8% rise across England.
- It has the 8th lowest average rent of the 45 councils in the East of England.
- It is cheaper to rent in than any of the 6 councils nearest to it.
- A second bedroom adds about £202 a month to the average rent here (£719 for one bedroom, £921 for two), against £142 across England.
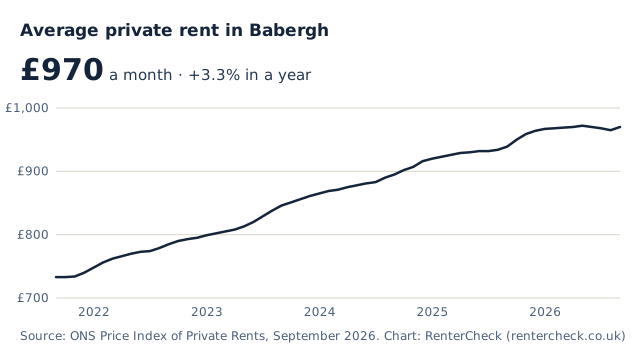
Average rent in Babergh
Monthly averages for private rented homes across Babergh, against England as a whole.
| Home | Babergh | England |
|---|---|---|
| 1 bedroom | £719 | £1,199 |
| 2 bedrooms | £921 | £1,341 |
| 3 bedrooms | £1,116 | £1,497 |
| 4 or more bedrooms | £1,605 | £2,170 |
| Home | Babergh | England |
|---|---|---|
| Flat or maisonette | £805 | £1,449 |
| Terraced house | £940 | £1,443 |
| Semi-detached house | £1,060 | £1,458 |
| Detached house | £1,300 | £1,649 |
These averages include tenants who moved in years ago, whose rent hasn’t kept up with the market, so a home advertised in Babergh today will usually ask more. To judge a rent you’ve been quoted, compare it with similar homes advertised near the address. How to check a rent or look up the average rent for a Babergh postcode.
Babergh and the councils around it
If you can live a little further out, the average rent changes quickly across a council boundary.
| Council | Average rent | Against Babergh | In a year |
|---|---|---|---|
| Babergh | £970 | — | |
| Braintree | £1,223 | £253 more | |
| Colchester | £1,200 | £230 more | |
| West Suffolk | £1,188 | £218 more | |
| Tendring | £1,058 | £88 more | |
| Mid Suffolk | £1,011 | £41 more | |
| Ipswich | £1,002 | £32 more |
What you need to earn, and to have saved
At Babergh’s average rents. Most letting agents look for a yearly income before tax of about 30 times the monthly rent. Upfront, the law caps the holding deposit at a week’s rent and the tenancy deposit at five weeks’ rent; most landlords also ask for the first month in advance.
| Home | Average rent | Income agents look for | Most deposit allowed | First month and deposit |
|---|---|---|---|---|
| 1 bedroom | £719 | £21,570 a year | £829 | £1,548 |
| 2 bedrooms | £921 | £27,630 a year | £1,062 | £1,983 |
| 3 bedrooms | £1,116 | £33,480 a year | £1,287 | £2,403 |
| 4 or more bedrooms | £1,605 | £48,150 a year | £1,851 | £3,456 |
Anything else, such as fees for viewings, referencing or admin, is banned. Work out the limits for your own rent or see how much rent you can afford. On Universal Credit or Housing Benefit? Find the Local Housing Allowance rate for a Babergh postcode, which caps the help you can get with the rent.
The landlord database in Babergh
England’s new database of private landlords is opening region by region. Babergh is in the East of England, where landlords can register from 15 January 2027 and must have registered by 14 April 2027, under the draft rollout. The East of England dates.
Check a home in Babergh
Found a place? The free check covers its energy rating, flood risk, crime nearby and past sales, in about a minute. Add the rent to see the most you can be asked for upfront.
Questions about renting in Babergh
What is the average rent in Babergh?
£970 a month across all private rented homes in Babergh, according to the Office for National Statistics for September 2026. A one-bedroom home averages £719. That average includes tenants who moved in years ago, so homes advertised today usually ask more.
How much do I need to earn to rent in Babergh?
Most letting agents want a yearly income before tax of about 30 times the monthly rent. At Babergh’s average of £970, that is £29,100 a year between the tenants, or £21,570 for an average one-bedroom home. It is a convention, not a law, so an agent can set its own figure.
How much deposit can a Babergh landlord ask for?
No more than five weeks’ rent while the rent is under £50,000 a year, under the Tenant Fees Act 2019. On Babergh’s average rent that is about £1,119, and a holding deposit is capped at one week’s rent, about £223. The deposit must be protected in a government-approved scheme within 30 days.
Is Babergh expensive to rent in?
The average rent in Babergh, £970 a month, is £496 less than the England average of £1,466. That makes it the 180th most expensive of 294 councils. The most popular areas cost more than the council-wide figure, so compare a quoted rent with homes advertised nearby.
Are rents going up in Babergh?
The average rent in Babergh was +3.3% on a year earlier in September 2026, against +4.0% across England. A landlord can raise the rent on a periodic tenancy only once a year, using a section 13 notice.
When does the landlord database start in Babergh?
Babergh is in the East of England. Under the draft rollout, landlords there can register from 15 January 2027 and must have registered every home they let by 14 April 2027. The dates are in draft regulations and could change.
Renting in other cities
Sources: ONS Price Index of Private Rents, September 2026, published 21 October 2026; Tenant Fees Act 2019. Contains public sector information licensed under the Open Government Licence v3.0.